
Tableau Server deployment
Install and configure Tableau Server, organize publishing and user access, and set up the agreed data refresh schedules.
Dashboards · Reporting · Data warehouses
ERPixel develops Tableau dashboards, reports and data warehouses that connect your business data. See where profit comes from, track performance against plan and give your team reporting it can use and understand.
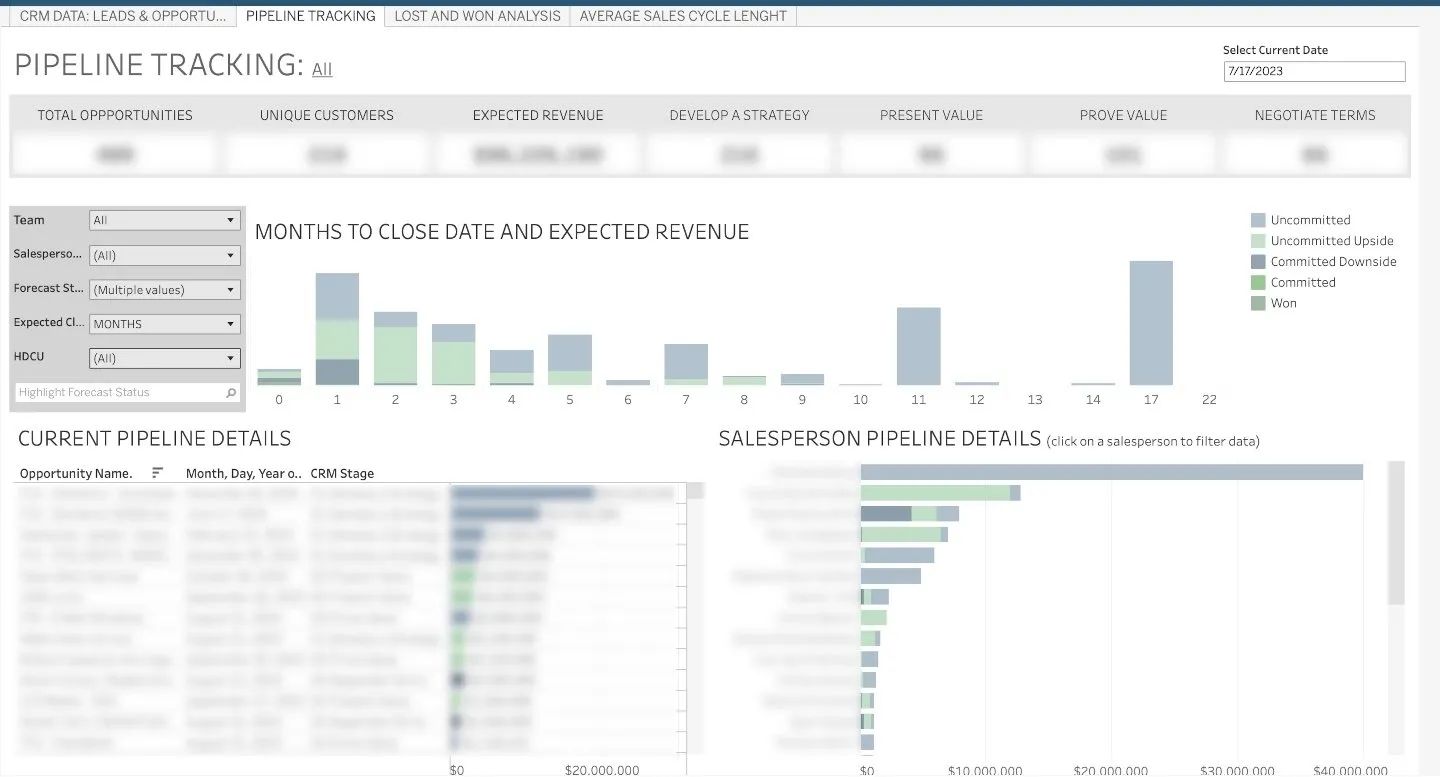
Tableau sales pipeline example. Sensitive data is blurred in the original screenshot.
What is Tableau?
Tableau is a professional analytics platform for turning data into interactive reports and dashboards. It can connect information from different sources, present it through polished visual interfaces and let business users explore results themselves. With prepared datasets, the right permissions and training, your team can also build its own reports, compare performance and investigate the details behind a number.
What ERPixel delivers
We cover the reporting interface, the data behind it and the way your people use it to manage the business.
Install and configure Tableau Server, organize publishing and user access, and set up the agreed data refresh schedules.
Build KPI dashboards, analytical reports and detailed tables with filters, calculations and drill-down views. Agree how each metric should be displayed and how users move from an overview to the underlying detail.
Create a data warehouse (DWH) with raw source-data tables and reporting tables. Develop scripts to clean, recalculate and aggregate records so Tableau receives consistent datasets for analysis.
Help management translate company goals into key performance indicators (KPIs). Define useful metrics, calculation rules, ownership and review routines so reporting supports practical management decisions.
Configure notifications for agreed KPI thresholds so management can notice a missed target and investigate. Alert conditions, recipients and timing are defined around the available data and refresh schedule.
Teach users to work with Tableau, read dashboards, use filters and create their own reports from prepared data. Document the datasets and reporting logic so the team can keep working after handover.
Who needs Tableau development?
These are examples of questions a Tableau solution can help answer. The required sources and calculations are agreed for your business.
Combine CRM records, billing data, website activity and Google Analytics to examine how much the company earns, which customers contribute to profit and which acquisition sources produce revenue. Agree how leads, customers and transactions are matched across systems.
Aggregate sales and cost data across channels to compare revenue, margin and contribution to the business. See which activities sustain the company today and where growth adds profitable business.
Compare planned activity, revenue and costs with actual results. Track how much work was planned, what was completed and how performance changed from the previous reporting period.
Explore activity, trends and product demand by country or customer segment. For example, if a new product is popular in several countries but attracts little attention in one region, your team can investigate and plan a focused campaign there.
Use threshold alerts to flag a KPI that falls outside its agreed range. Give the responsible manager a defined signal and a dashboard for investigating the deviation while there is still time to respond.
Manufacturers can analyze prepared sensor readings and production signals. Service businesses can follow new customer arrivals, demand and service activity. We agree how those events are collected and aggregated, and how frequently the resulting reports need to update.
Start with a business question
Send an existing report, a list of source systems or a question your team cannot answer reliably. We will use it to discuss the metrics, data and Tableau work your project needs.
Why ERPixel
More than a decade of ERP work gives us practical experience with the transactions and business processes behind the figures. We bring that understanding into the reporting model, calculations and dashboards.
Our strengths include business profitability, unit economics and financial reporting, including reporting based on IFRS requirements. We agree accounting policies, metric definitions and source mappings with the people responsible for finance.
We connect operational systems and develop the warehouse and processing logic needed to combine their data. The reporting model reflects how sales, costs, inventory and other events are recorded in the source systems.
Our portfolio includes Tableau Server deployment, financial and inventory dashboards, sales pipeline analysis and reporting across multiple business units. We use that experience to make complex reporting understandable and maintainable.
Published examples of the data integration, reporting and Tableau work ERPixel has delivered.
1 / 3
The manufacturer needed reports for different business owners and departments, using ERP records together with Google Ads, Google Analytics and LinkedIn data.
ERPixel implemented a data warehouse and Tableau Server with dashboards for sales, pipeline analysis, lead conversion, pipeline win rate, inventory stock turnover, financial reporting and unit economics.
managers can examine sales and marketing alongside operational data in a centralized reporting environment. Sales owners can follow pipeline conversion, inventory owners can review stock turnover, and finance can use the financial dashboards rather than treating each source as a separate picture.
The holding operated across retail and wholesale auto parts, vehicle services and financial insurance. Management needed a consolidated view of margins, profitability and operations across business units, while the data lived in SAP, Odoo, accounting software and Excel.
ERPixel built a PostgreSQL DWH and Java ETL services to extract, clean and standardize the data. Tableau dashboards covered financial performance, workforce indicators and inventory. Delivery was divided into twelve focused reporting workstreams so each area could be reviewed incrementally.
leadership can review business units through a unified reporting platform, compare revenue and profitability, and investigate workforce and stock indicators. Consolidation reduces the manual effort needed to compile and analyze information from separate systems.
The manufacturer needed an analytical layer that could combine a complex Odoo environment with marketing and external data. Management needed to understand regional profitability, sales-channel performance and the relationship between marketing activity and eventual sales.
ERPixel connected operational ERP data to a separate data warehouse and Tableau analytics layer. The wider implementation brought together manufacturing, sales, service, finance and logistics data, with Google Ads, Google Analytics and LinkedIn integrations supporting marketing analysis.
management can analyze profitability across markets and channels, examine product performance and service costs, and connect recorded marketing interactions with subsequent purchases. Combining ERP and external data supports questions that the ERP alone cannot answer.
How we work
You explain what the business needs to understand. Together we define the reporting plan, build the solution and review it in useful iterations.
Discuss your needs, break company goals down into measurable indicators and identify the data that supports each metric. Agree definitions, reporting users and the decisions they need to make.
Result: An agreed set of metrics and business questions.
Identify which sources are needed, what form their data takes, how records relate and how often they must update. Prioritize the datasets and reports so the first delivery answers useful questions.
Result: A roadmap covering sources, data structure and reporting priorities.
Set up the data warehouse where needed, connect source systems and write data-cleaning, recalculation and aggregation scripts. Prepare the datasets and connections Tableau will use.
Result: Reporting datasets with agreed refresh schedules.
Build KPI reports, dashboards and data tables. Review the figures and visual presentation with your team, reconcile them with source records and refine the reports iteratively until the agreed indicators are visible and understandable.
Result: Reviewed dashboards that answer the agreed business questions.
Document every report: what each metric includes, its sources, calculation rules, data freshness and assumptions. For profitability, explain which revenue and costs are included. Train users to interpret the figures and create their own views.
Result: A documented reporting system and a team prepared to use it.
Tableau dashboards
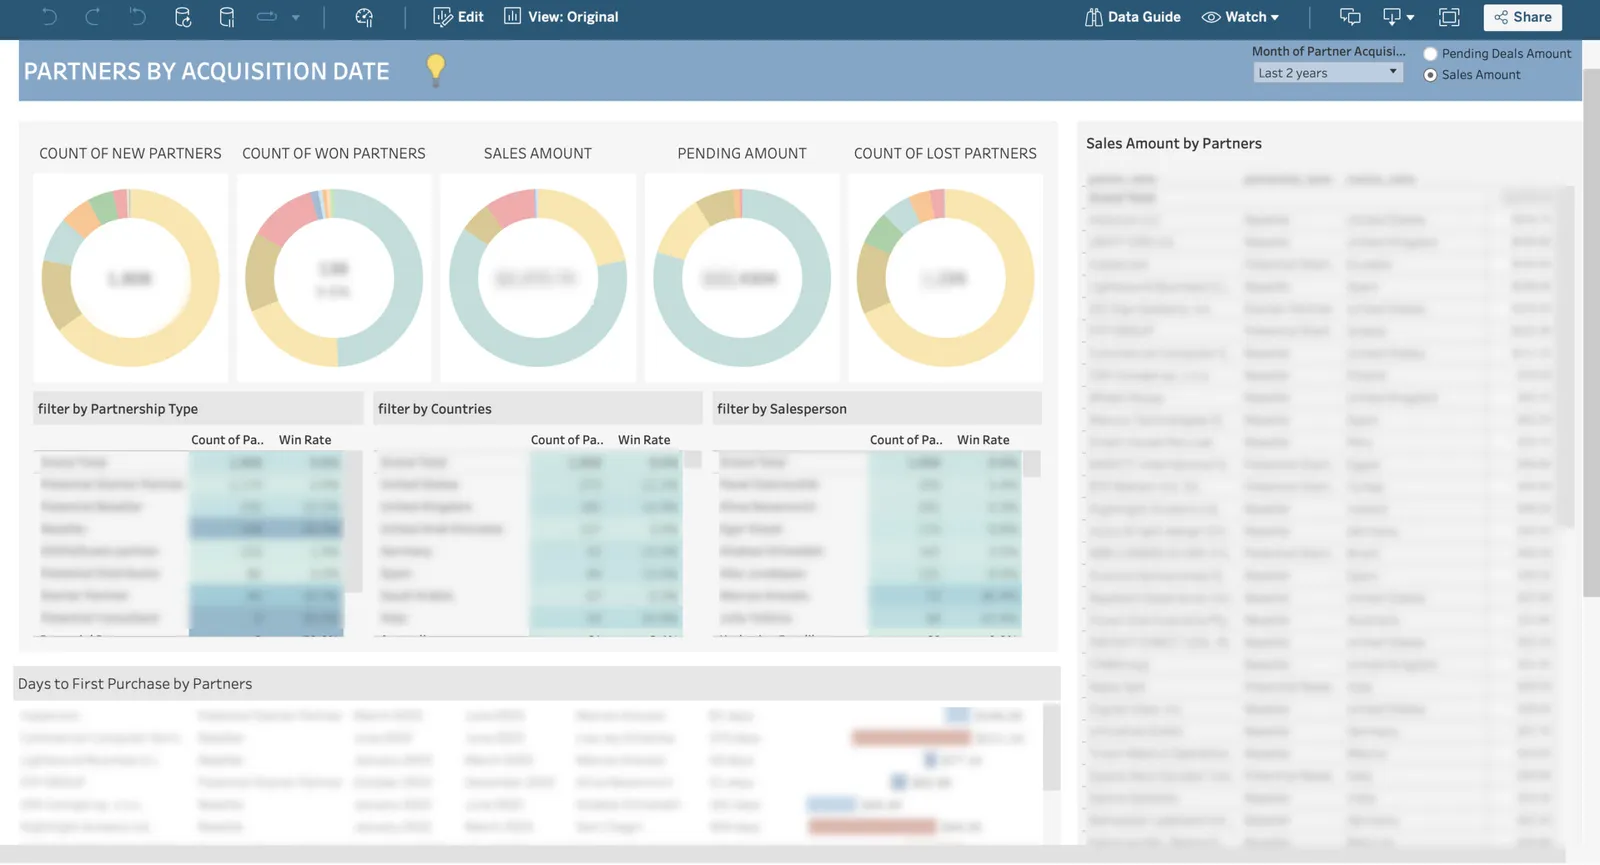
Two Tableau dashboard examples showing reporting layouts, filters and analytical views. Sensitive values and identifying details are blurred in the original screenshots.
What your business gains
The value comes from connecting visible changes to understandable numbers and practical decisions.
Bring agreed indicators from multiple business systems into one dashboard where useful. See changes automatically as source data is refreshed on the agreed schedule.
Use visual comparisons to notice patterns, shifts and exceptions that are difficult to identify in disconnected tables. Explore the detail before choosing a response.
Give finance, sales and operations a shared view of defined metrics. Review information together and discuss the figures and their context across departments.
Compare plans with actual performance, understand deviations and use those findings in the next planning cycle. Keep the meaning and limitations of the figures visible.
Compare customers, channels, products and regions to understand what drives revenue and profitability, and where additional activity may support growth.
Share selected reports with appropriate access to explain performance, trends and the logic behind your numbers. Give investors a clear view of how management monitors the business and uses its figures to make decisions.
Related ERPixel services
Plan the wider BI architecture, data ownership and reporting environment across your organization.
Business Intelligence ImplementationConnect Odoo with the operational and financial systems that supply your reporting data.
Odoo IntegrationConnect reporting signals with agreed actions and workflows across business applications.
Business Process AutomationBuild integration workflows and notifications around your existing applications and business rules.
n8n DevelopmentLet’s discuss your reporting
Tell us which decisions need better information, where your data lives and what you want to see in Tableau. We will discuss the scope, priorities and a practical path from source data to working reports.
By ERPixel